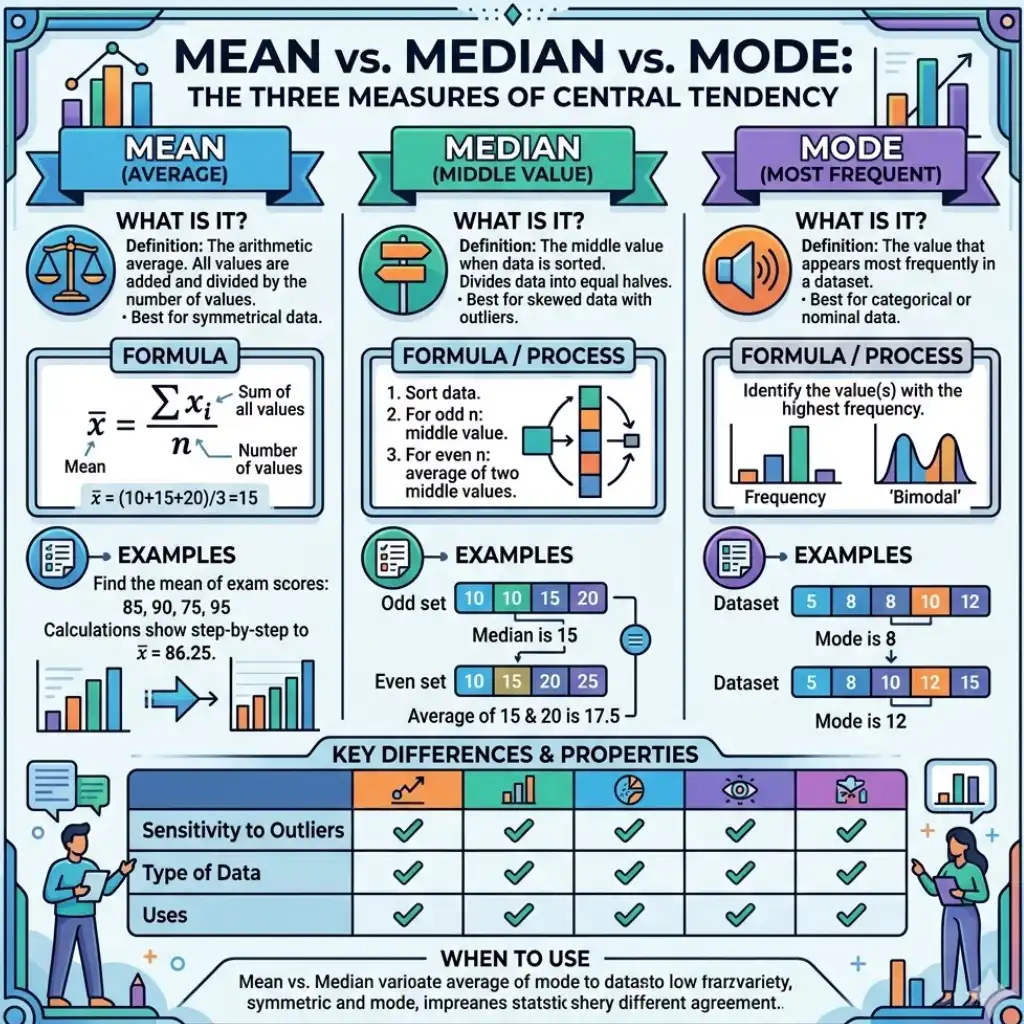
What Is the Difference Between Mean, Median and Mode?
Many students confuse average with median or mode. Exam questions look simple, yet small mistakes reduce marks. Understanding the real mean median mode difference builds clarity in statistics. These three values fall under one idea called central tendency. Once you understand when to use each one, calculations become easy and logical.
In this blog, you will learn how to calculate mean median mode with definitions, formulas, solved examples, real-life relevance, and practical tips to avoid common errors.
What Are Measures of Central Tendency? Central Tendency Definition Explained
Before comparing them, let us understand the broader concept. The term measures of central tendency refers to statistical values used to represent the center of a dataset. In simple words, they show the typical value in a group of numbers.
The central tendency definition in mathematics describes it as a method to summarize large data into one representative figure. Instead of looking at 100 marks for each exam, you calculate the central number to determine the performance of the entire class.
The three most important measures are:
- Mean
- Median
- Mode
Each tells a different tale of the same information.
What Is Mean in Maths and How Do You Calculate It?
If students are asking what is mean in maths, the answer is easy. The mean is the sum of all numbers. Each number is added and then divided by the total number.
The most basic mean median mode formula used to determine the mean includes:
Mean is the summation of the observations the total number of observations
For instance:
The marks scored by 5 students are Students scored marks of 60, 70, 70, 90, 100
Step 1: Add the values - 60 + 70 + 80 +90 + 100 equals 400
Step 2: Divide by 5 - 400 / 5 = 80
Also, the median is about 80.
When Should You Use Mean?
Mean is most effective when the data's values are evenly distributed, without extreme outliers.It gives an overall performance picture and is widely used in economics, education, statistics, and scientific research.
What Is Median in Statistics and Why Is It Useful?
If you're wondering what is median in statistics, think of it as the middle point in an ordered data set. The numbers are arranged from the smallest to the largest, and everyone find the center
With the same marks as in the example: 60 70, 80, 90 100
The center is 80 The median is 80.
If the data set is even in its values, choose the average of two numbers in the middle.
When Should You Use Median?
Median is a useful tool when data contains extreme values. For instance, the distribution of income typically shows wide gaps between the top and bottom earners. Median is a more realistic central value in these situations.
Governments often report the median household income as it is a better reflection of typical earnings than the average income.
What Is Mode in Maths and Where Is It Applied?
Students often ask, what is mode in maths. Mode refers to the number that appears most frequently in a dataset.
Example:
2, 3, 4, 4, 5, 6
Here, 4 appears twice while others appear once. So, the mode is 4.
Mode does not require formulas. You simply identify the most repeated value.
When Is Mode Helpful?
Mode works best for categorical data. For example, if most students choose Science over Commerce, Science becomes the mode. Businesses use mode to identify popular products.
Mode can also have more than one value if multiple numbers repeat equally.
Mean vs Median vs Mode Examples for Clear Understanding
Let us compare all three using a new dataset.
Monthly salaries (in ₹ thousands):
20, 22, 25, 30, 150
Step-by-step analysis:
- Mean = (20 + 22 + 25 + 30 + 150) ÷ 5 = 247 ÷ 5 = 49.4
- Median = 25
- Mode = No repetition, so no mode
This example clearly shows the mean median mode difference. The mean becomes 49.4 due to one high salary (150). Median remains 25, which better reflects typical earnings.
These mean vs median vs mode examples highlight why choosing the correct measure matters in real analysis.
How to Calculate Mean Median Mode Step by Step?
Many learners struggle with the process. Understanding how to calculate mean median mode improves accuracy in exams.
Step 1: For Mean
Add all observations carefully. Divide the total by the number of values. Always check calculation errors because a small addition mistake affects the final answer.
Step 2: For Median
Arrange data in ascending order. Identify the middle value. If the number of terms is even, take the average of the two central values. Never skip the sorting step.
Step 3: For Mode
Scan the dataset and count the frequency of each value. The number with the highest frequency becomes the mode. If no number repeats, the mode may not exist.
Practicing regularly reduces confusion.
Mean Median Mode Problems with Solutions for Practice
Solving examples improves conceptual clarity. Here are a few easy mean median mode problems that have solutions.
Example 1:
Numbers: 5, 7, 9, 7, 10
Mean = (5 + 7 + 9 + 7 + 10) / 5 = 38 / 5 = 7.6
Median = 7
Mode = 7
Example 2:
Numbers: 3, 8, 12, 15
Mean = 9.5
Median = (8 + 12) / 2 = 10
Mode = No repetition
These examples illustrate how results can differ based on the distribution of data.
Why Are These Concepts Important in Real Life?
Understanding averages helps interpret real statistics. According to the World Bank, India’s GDP growth was around 7% in 2023–24 Such averages reflect economic performance.
In education, schools calculate average board scores to measure performance trends. In business, companies analyze average sales growth to plan expansion.
Without clarity in central values, data interpretation becomes misleading.
Common Mistakes Students Should Avoid
Students are often guilty of making mistakes when solving central tendency problems.
- Not remembering to arrange the numbers before finding the median
- The wrong calculation of the totals in the average
- Confusing mode vs median
- Insisting on outliers in analysis
Knowing the measures of central tendency correctly can help avoid such errors.
How Students Can Master These Concepts Easily
Concept clarity improves with guided practice. Interactive learning, real-life datasets, and structured explanations make topics simpler.
Platforms like AAS Vidyalaya offer focused academic support for statistics topics. Many learners also benefit from trusted e learning platforms in india that provide step-by-step concept breakdown and problem-solving sessions.
Regular practice builds confidence and accuracy.
Conclusion
The mean median mode difference becomes simple once you understand how each value represents data differently. Mean gives the overall average, median shows the middle position, and mode highlights the most frequent number within the measures of central tendency.
If you remember the correct mean median mode formula and know how to calculate mean median mode, you can solve problems with confidence. The right method depends on the dataset and its distribution.\
1. What is the main difference between mean, median, and mode?
The mean is the average of all values, the median is the middle value in a sorted dataset, and the mode is the most frequently occurring number. Each represents the data differently.
2. When should you use mean instead of median?
Use the mean when data is evenly distributed without extreme values (outliers). If outliers are present, the median provides a more accurate representation.
3. Can a dataset have more than one mode?
Yes, a dataset can have more than one mode if multiple values occur with the same highest frequency. This is called bimodal or multimodal data.
4. Why is median considered better for income data?
Median is preferred for income data because it is not affected by extremely high or low values, giving a more realistic picture of typical earnings.
5. What are common mistakes students make when calculating mean, median, and mode?
Common mistakes include not arranging data before finding the median, calculation errors in mean, and confusing mode with median